In a 48-hour datathon, a five-person Berea College team asked why one in four engaged patients at Stormont Vail Health never came back. The answer turned out to lie in how the system delivered care rather than in who the patients were, and the analysis took the Best Data Analysis Award against six other Kentucky institutions.
Our approach
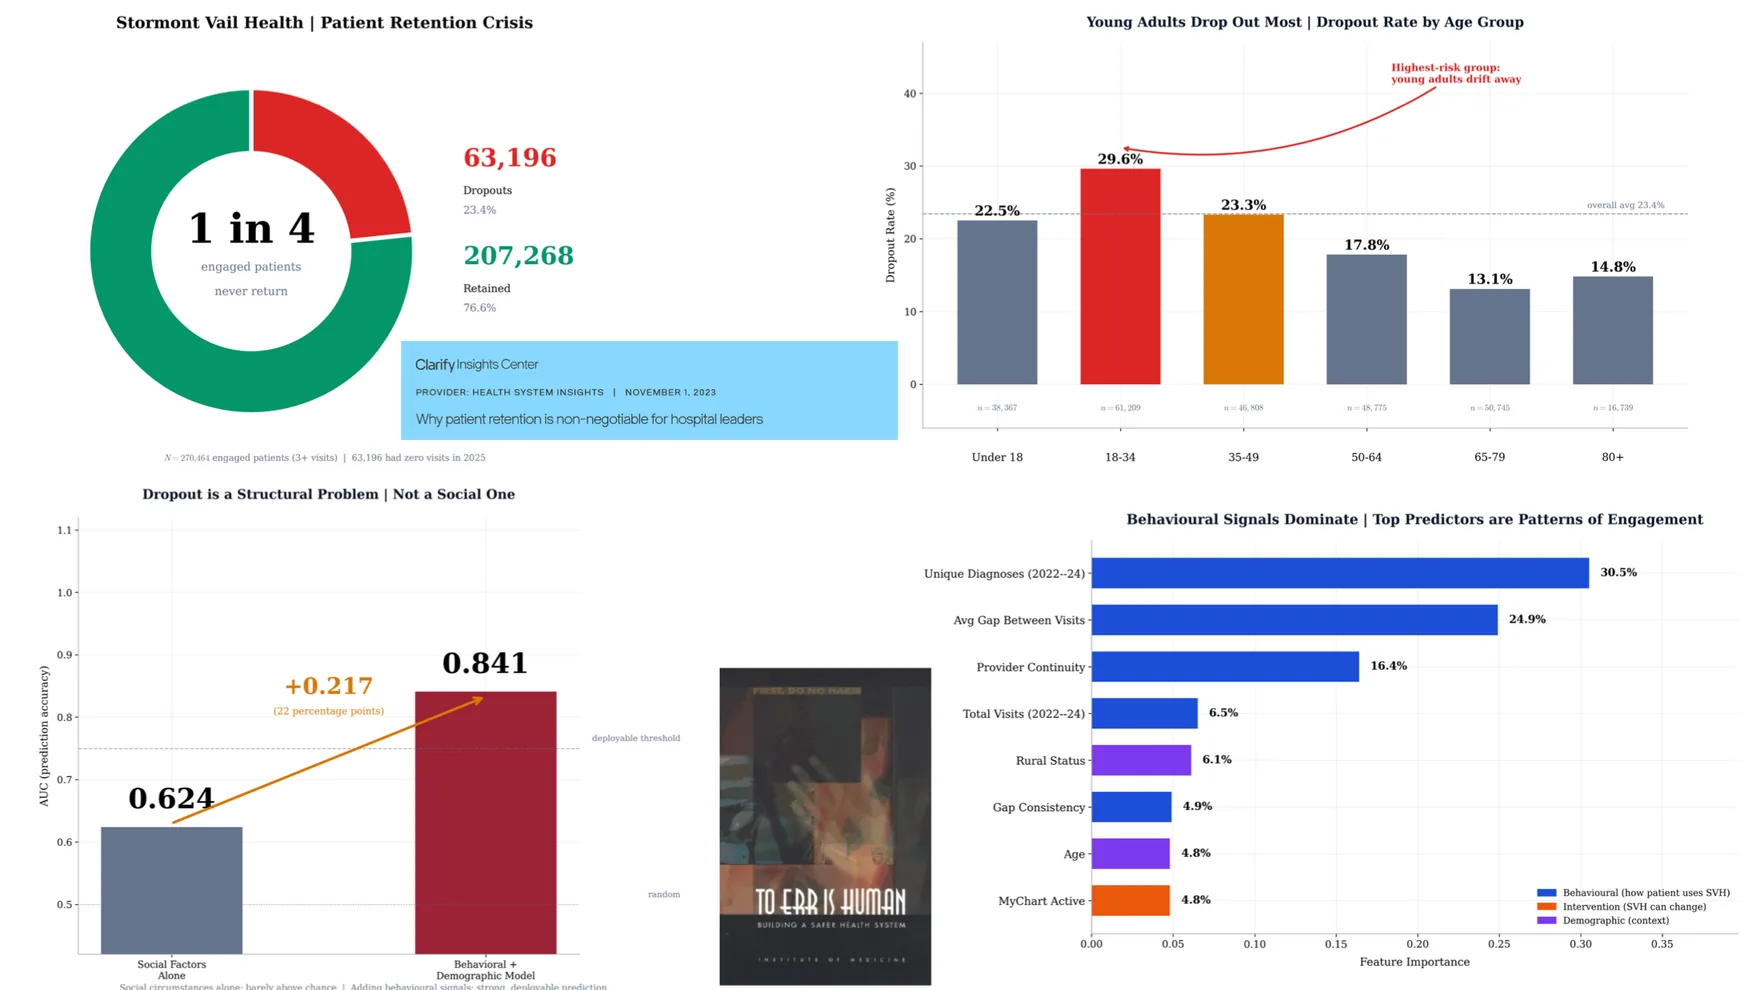
The dataset covered 270,464 engaged patients, each with three or more visits on record. Of those, 63,196 had no visit at all in 2025, a dropout rate of 23.4 percent. That absence became the label we set out to predict.
We built two classifiers side by side. The first used only social and demographic factors: age, rural or urban residence, and similar context. The second added behavioral signals drawn from the visit history itself, such as the average gap between visits, how consistent those gaps were, how many distinct providers a patient saw, the number of unique diagnoses, and whether the patient used telemedicine or an active MyChart account. Comparing the two on AUC told us how much of dropout is explained by circumstance and how much by the pattern of care.
We then clustered patients into natural types by how they used the system, rather than by who they were, and cross-tabulated rural status against telemedicine use to see which combinations the health system could act on.
I set the analytical direction, built the deck, and co-presented to the judges.
What we found
- Behavior predicts dropout far better than demographics. Social factors alone reached an AUC of 0.624, barely above chance. Adding behavioral signals lifted it to 0.841, a gain of 22 percentage points and past the threshold for a deployable model. The three strongest predictors were unique diagnoses (30.5 percent of feature importance), the average gap between visits (24.9 percent), and provider continuity (16.4 percent). Rural status and age each carried under 7 percent.
- Young adults drift away most. Patients aged 18 to 34 dropped out at 29.6 percent against an overall average of 23.4 percent. Those aged 65 to 79 dropped out at 13.1 percent.
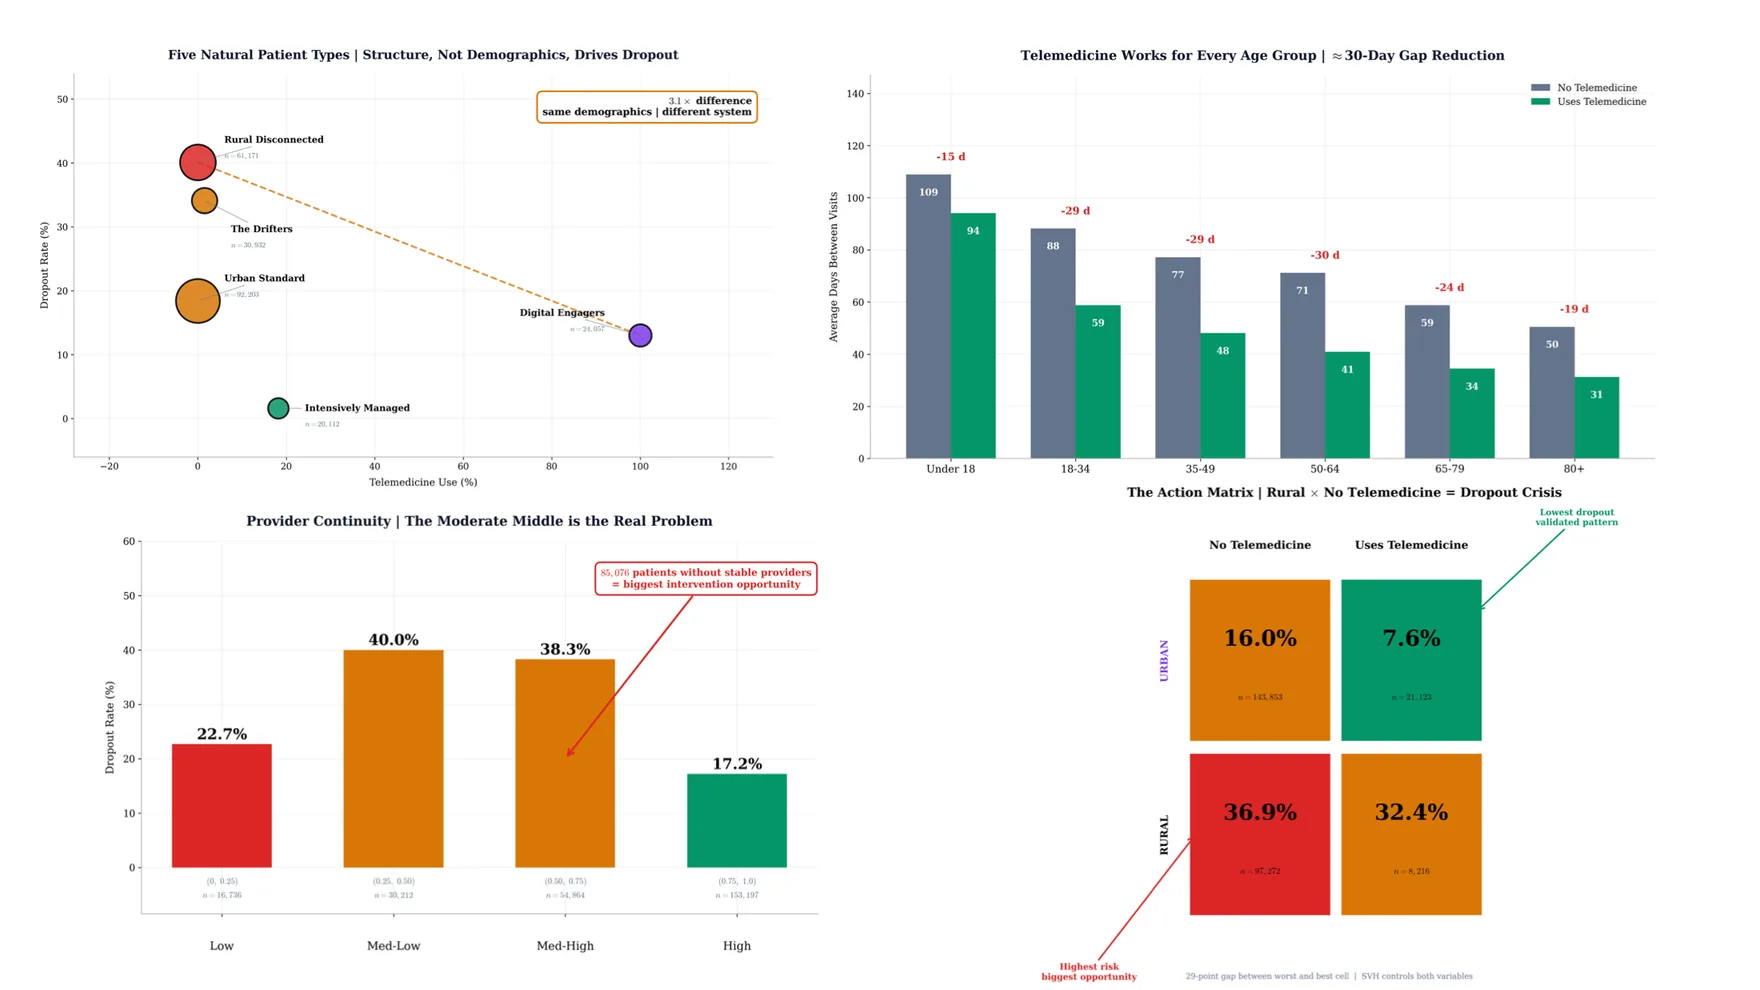
- Structure, not demographics, separates the patient types. Five natural clusters emerged. The Rural Disconnected group, over 61,000 patients with no telemedicine use, dropped out at roughly 40 percent. Digital Engagers, who used telemedicine for every visit, dropped out at about 13 percent. That is a 3.1 times difference between groups with similar demographics and a different relationship to the system.
- Telemedicine shortens the gap between visits for every age group. Patients who used telemedicine averaged roughly 30 fewer days between visits than those who did not, and the effect held from under 18 to over 80.
- The moderate middle is the real problem. Patients with partial provider continuity dropped out at 40.0 percent and 38.3 percent, worse than those with almost no continuity (22.7 percent) and far worse than those with a stable provider (17.2 percent). That middle band holds 85,076 patients and is the largest single intervention opportunity.
- Two levers the system controls explain a 29-point gap. Rural patients without telemedicine dropped out at 36.9 percent. Urban patients who used telemedicine dropped out at 7.6 percent. Both rural outreach and telemedicine access are within the health system's control, which is why we framed retention as a structural issue rather than a social one.
Limitations
- The data came from a single health system, so the patterns may not transfer to systems with a different rural footprint or telemedicine rollout.
- Dropout was defined as zero visits in 2025 after three or more earlier visits. Patients who moved, changed insurers, recovered, or died all count as dropouts under that definition.
- The relationships are associations. Patients who adopt telemedicine or keep a stable provider may differ in ways the records do not capture, so the results point to where to intervene rather than prove that an intervention would work.
- Everything was built in 48 hours. The model was cross-validated on the competition data but not tested on a held-out year or a second system.