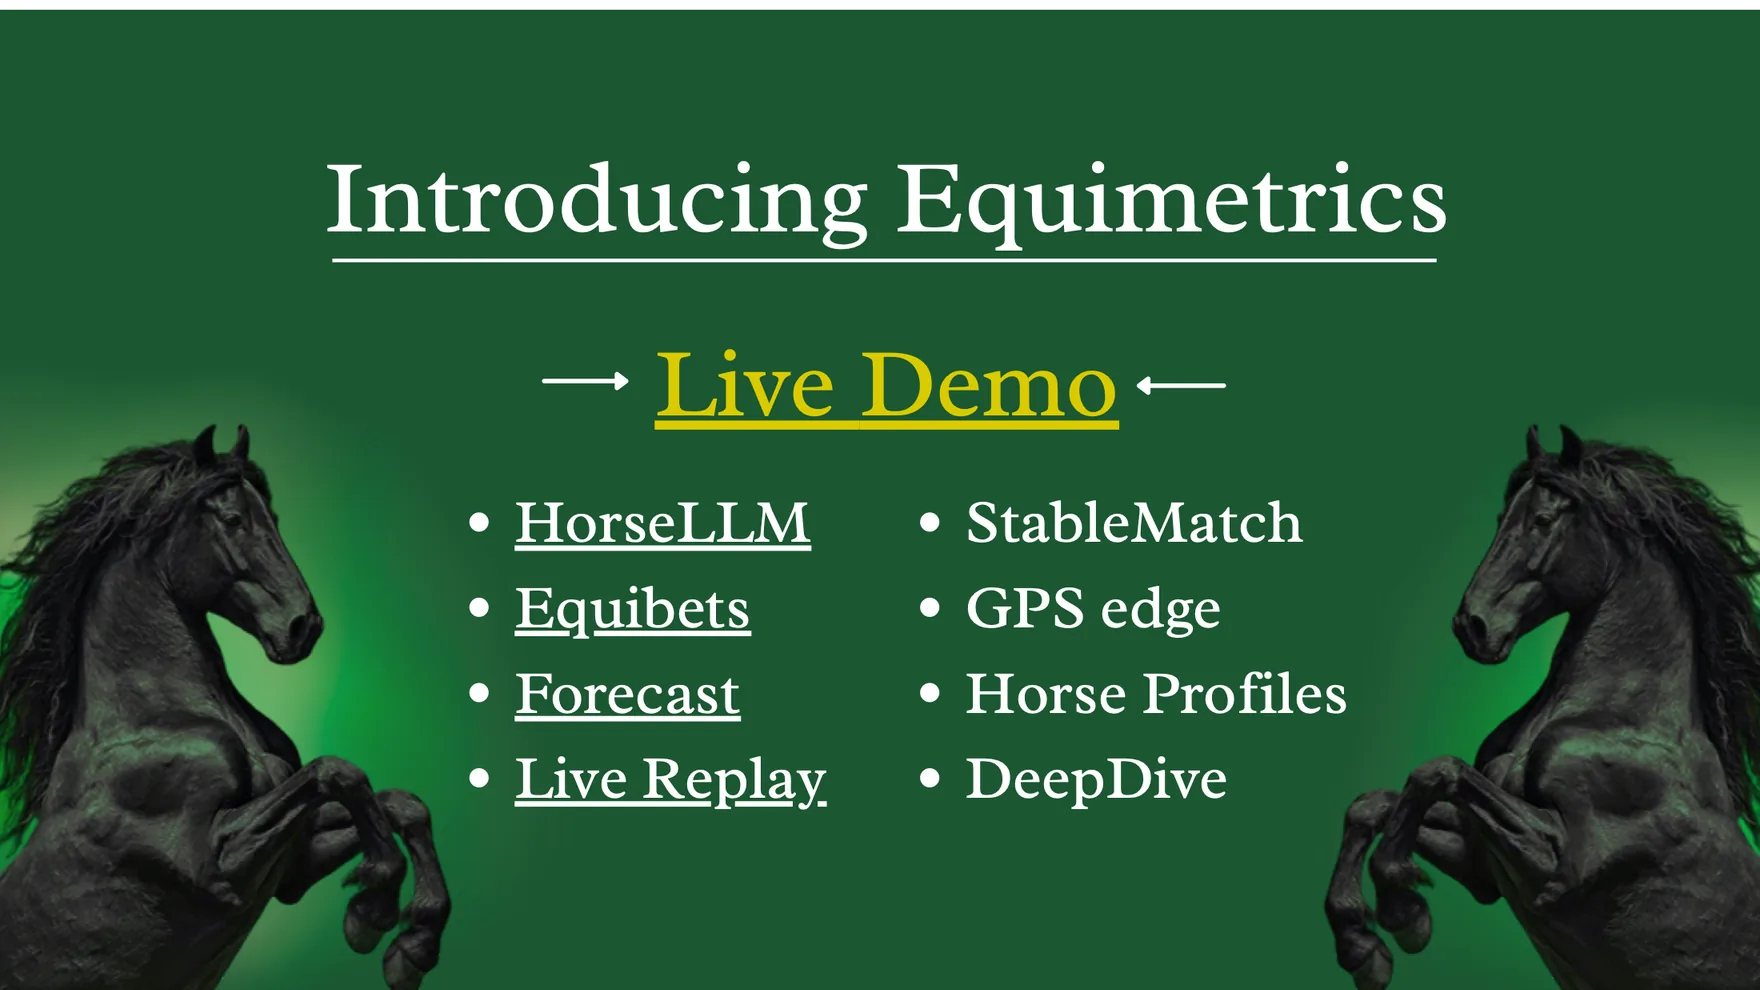
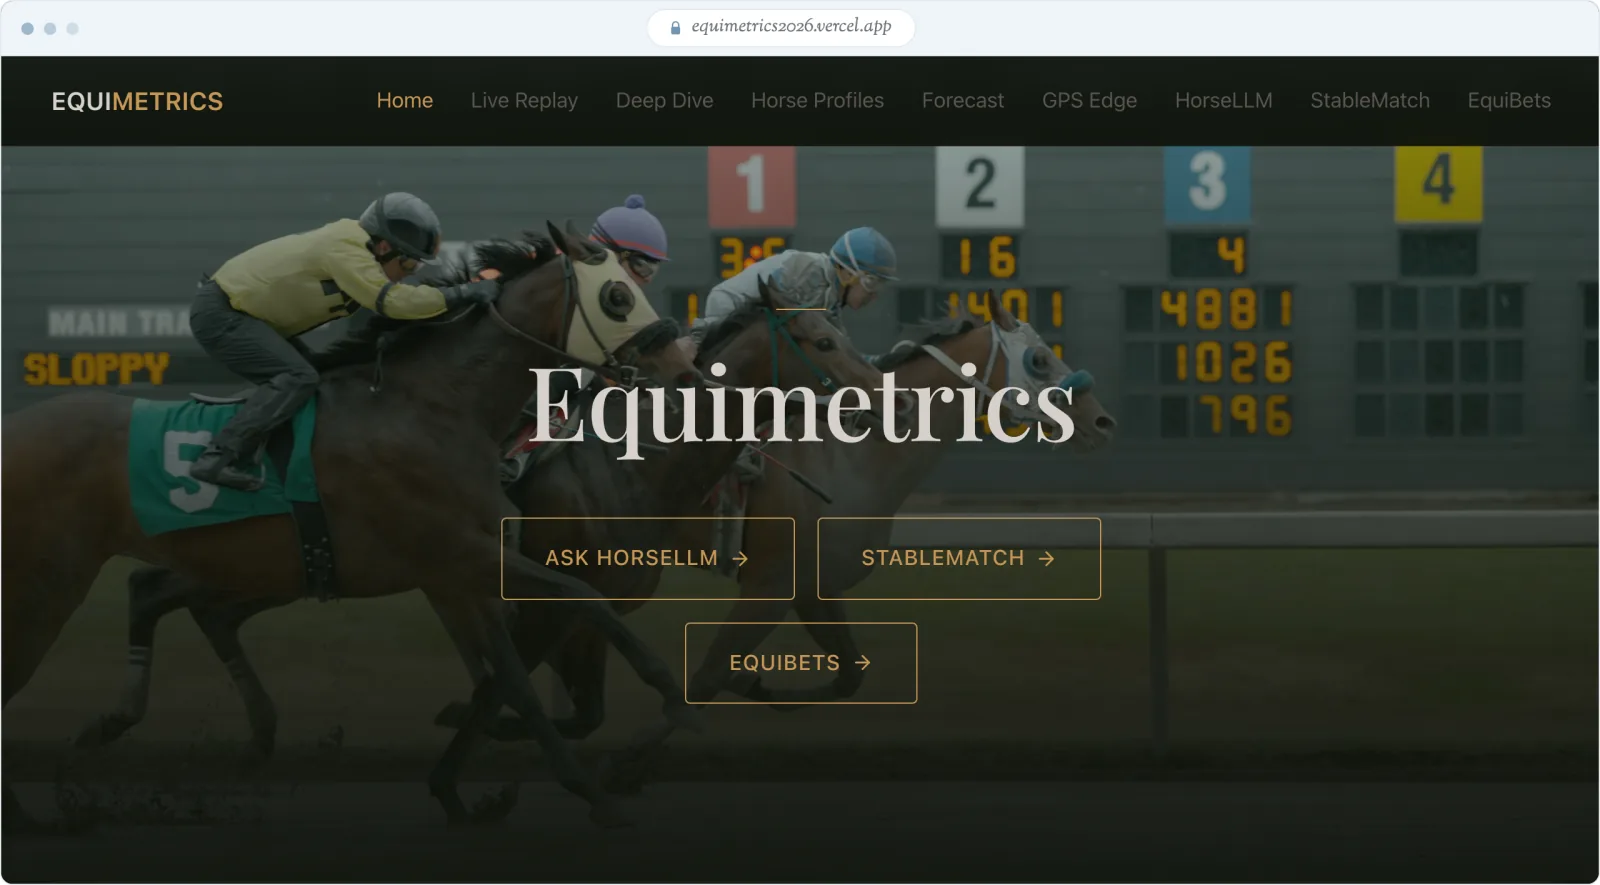
The Econ Games 2026 asked teams to turn a season of GPS telemetry from North American racetracks into something a fan could actually use. In 24 hours a Berea College team shipped EquiMetrics, an eight-tool race analysis platform, and won first place against 29 universities along with a $3,000 prize and a five-year Stata license.


Our approach
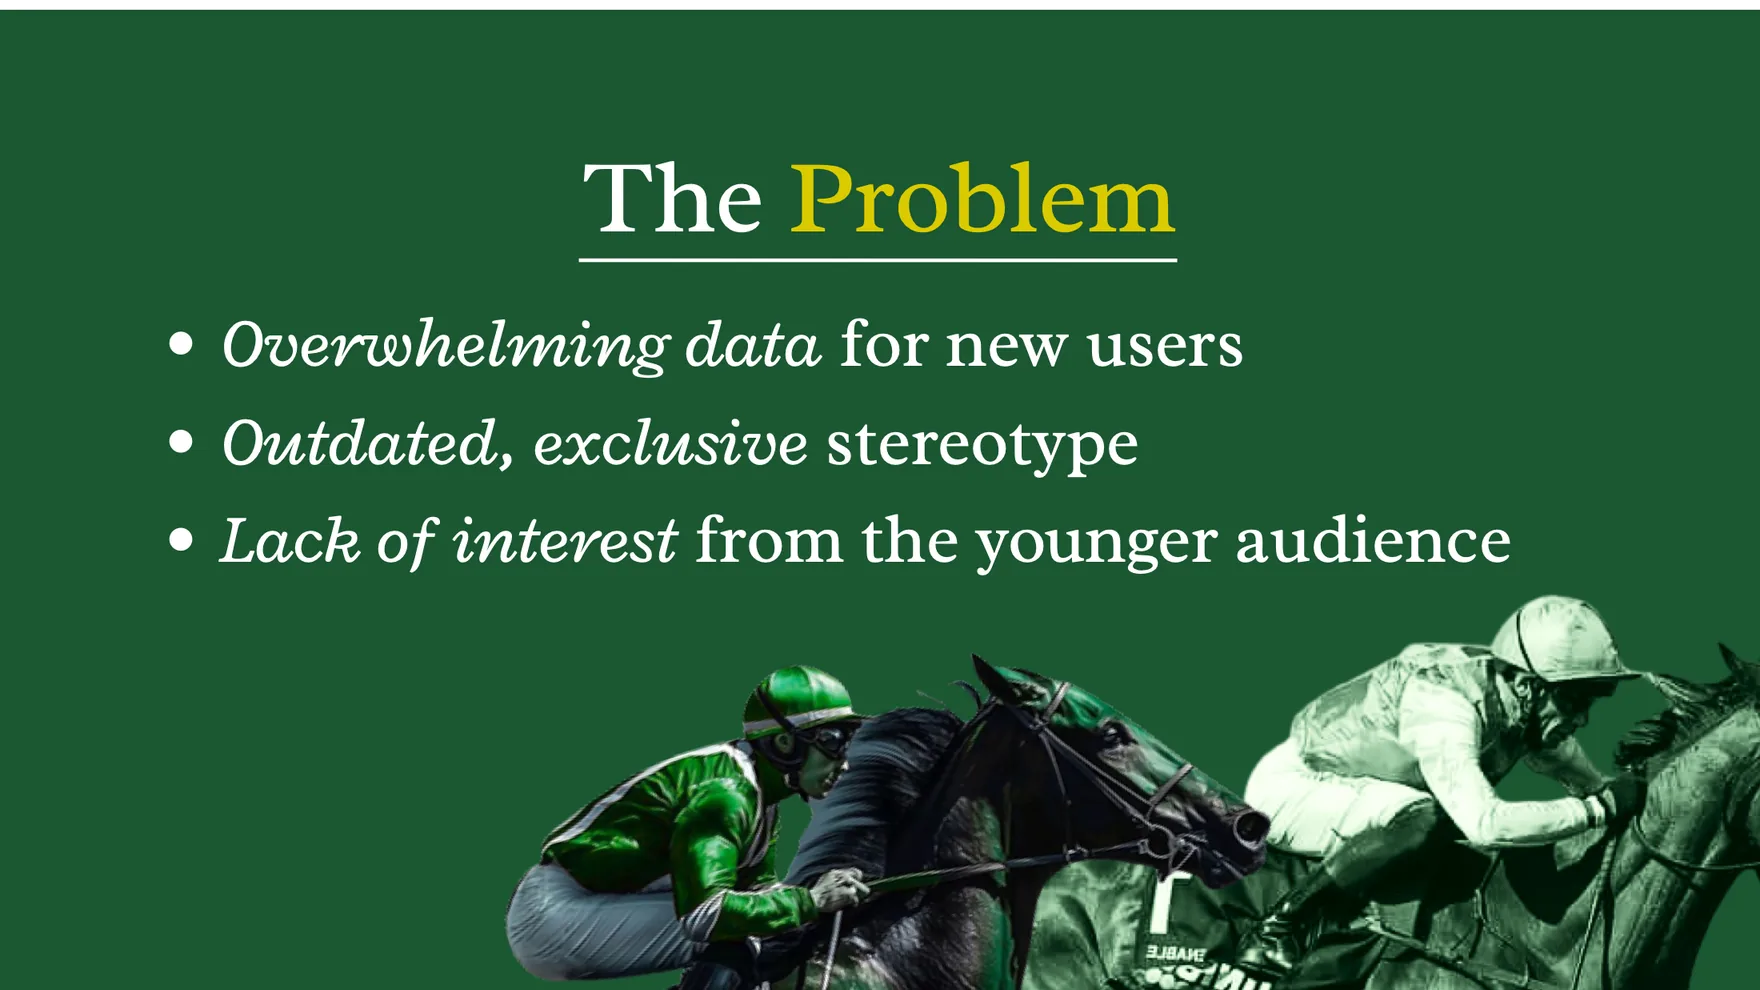
The prompt was to build a practical, interactive tool from GPS metrics that gave engaging race insights even at tracks without GPS. We framed the problem around three things holding racing back: the data is overwhelming for new users, the sport carries an outdated and exclusive stereotype, and younger audiences are not interested.
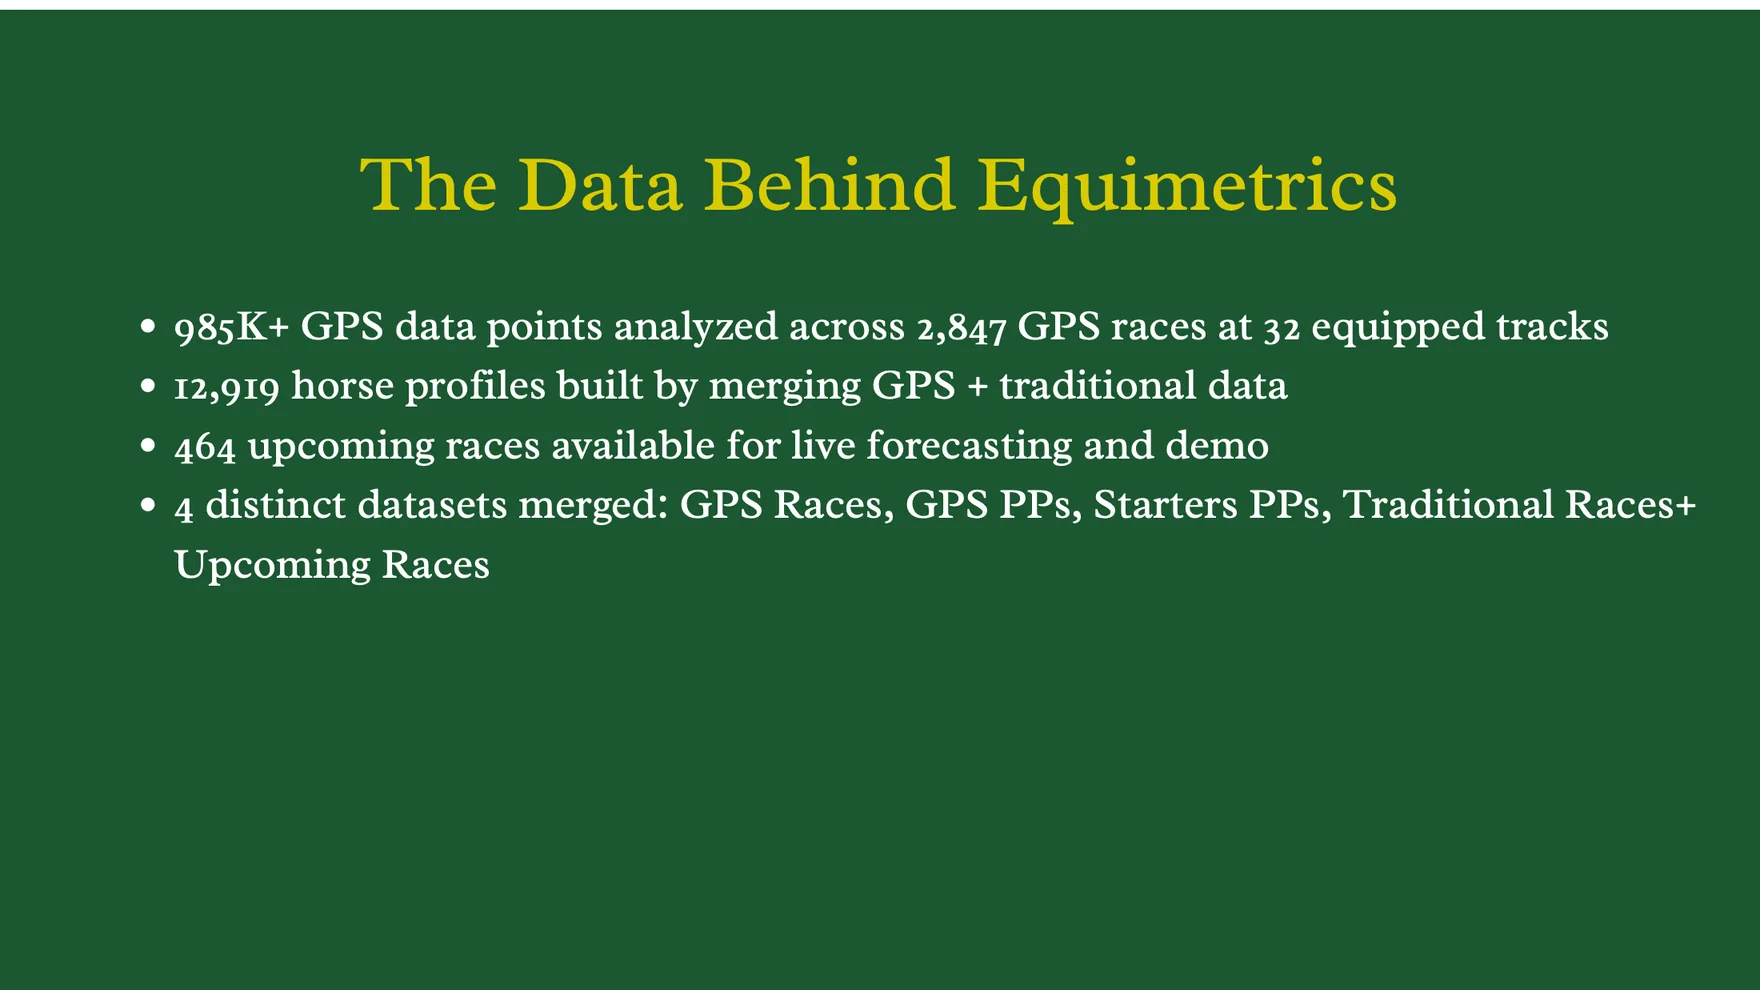
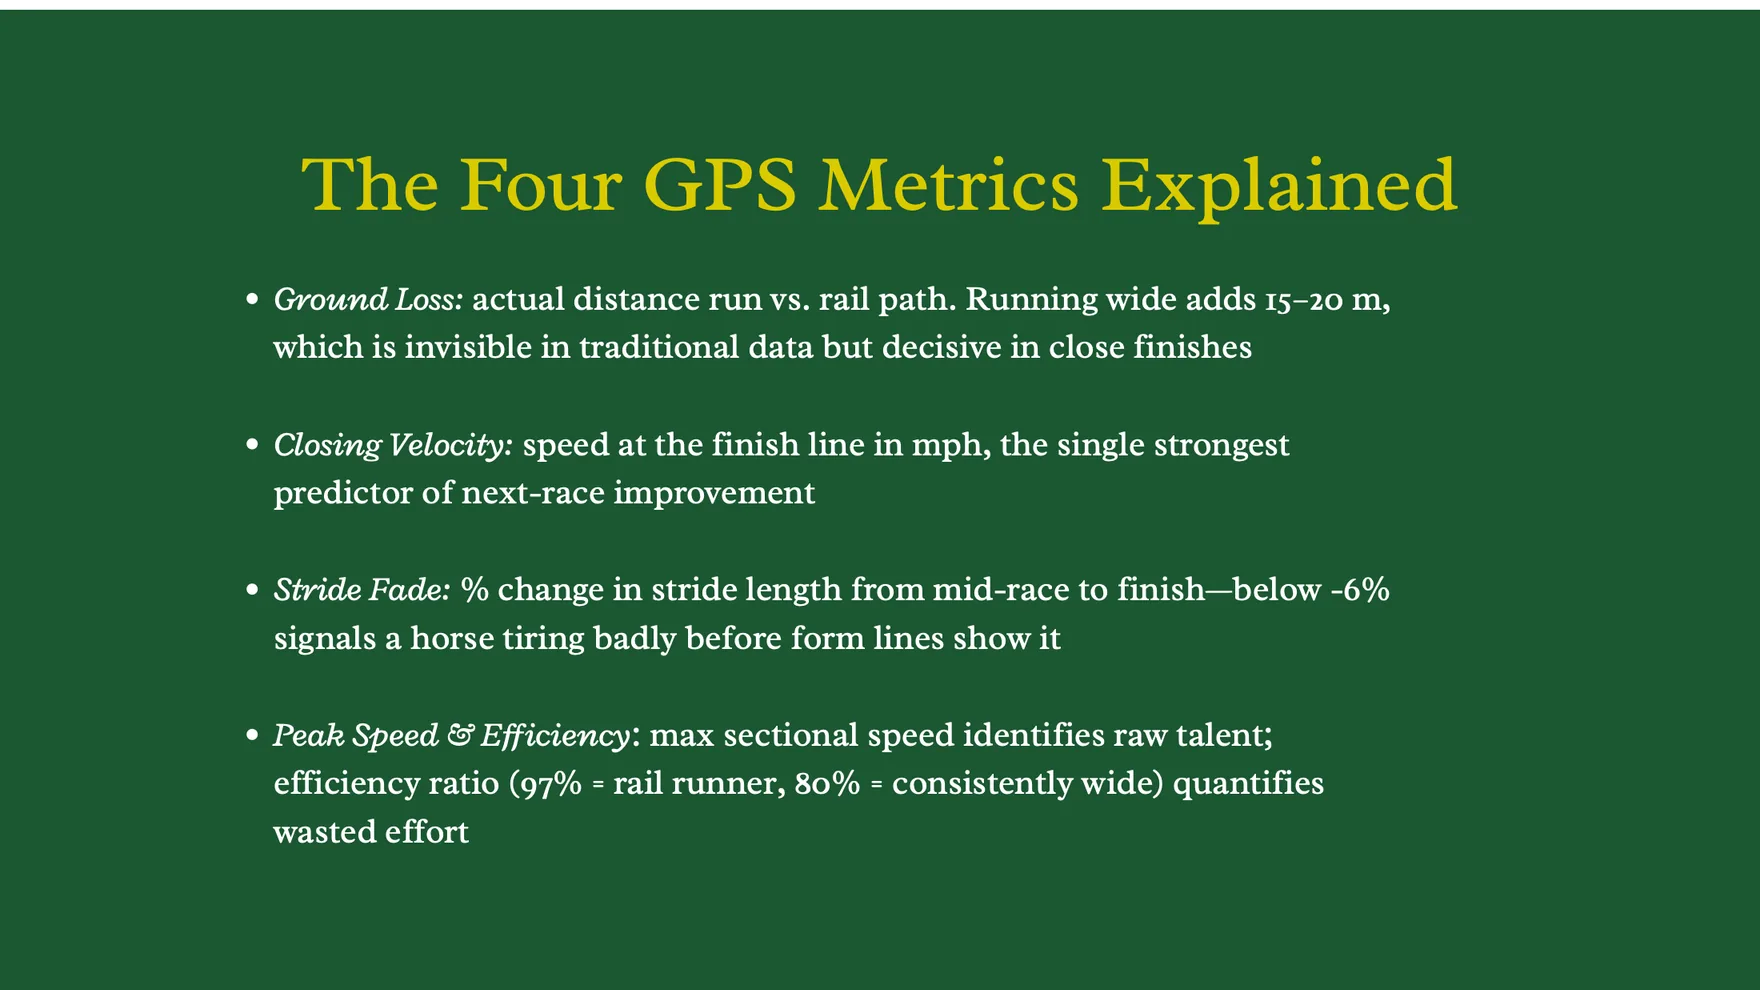
We merged four datasets, GPS races, GPS past performances, starter past performances and traditional race records, into one index. That gave us 985,000+ GPS data points across 52,767 race starts and 12,919 horse profiles that combine GPS and traditional form. From the telemetry we derived four metrics that conventional charting cannot see: ground loss, closing velocity, stride fade, and peak speed with an efficiency ratio.
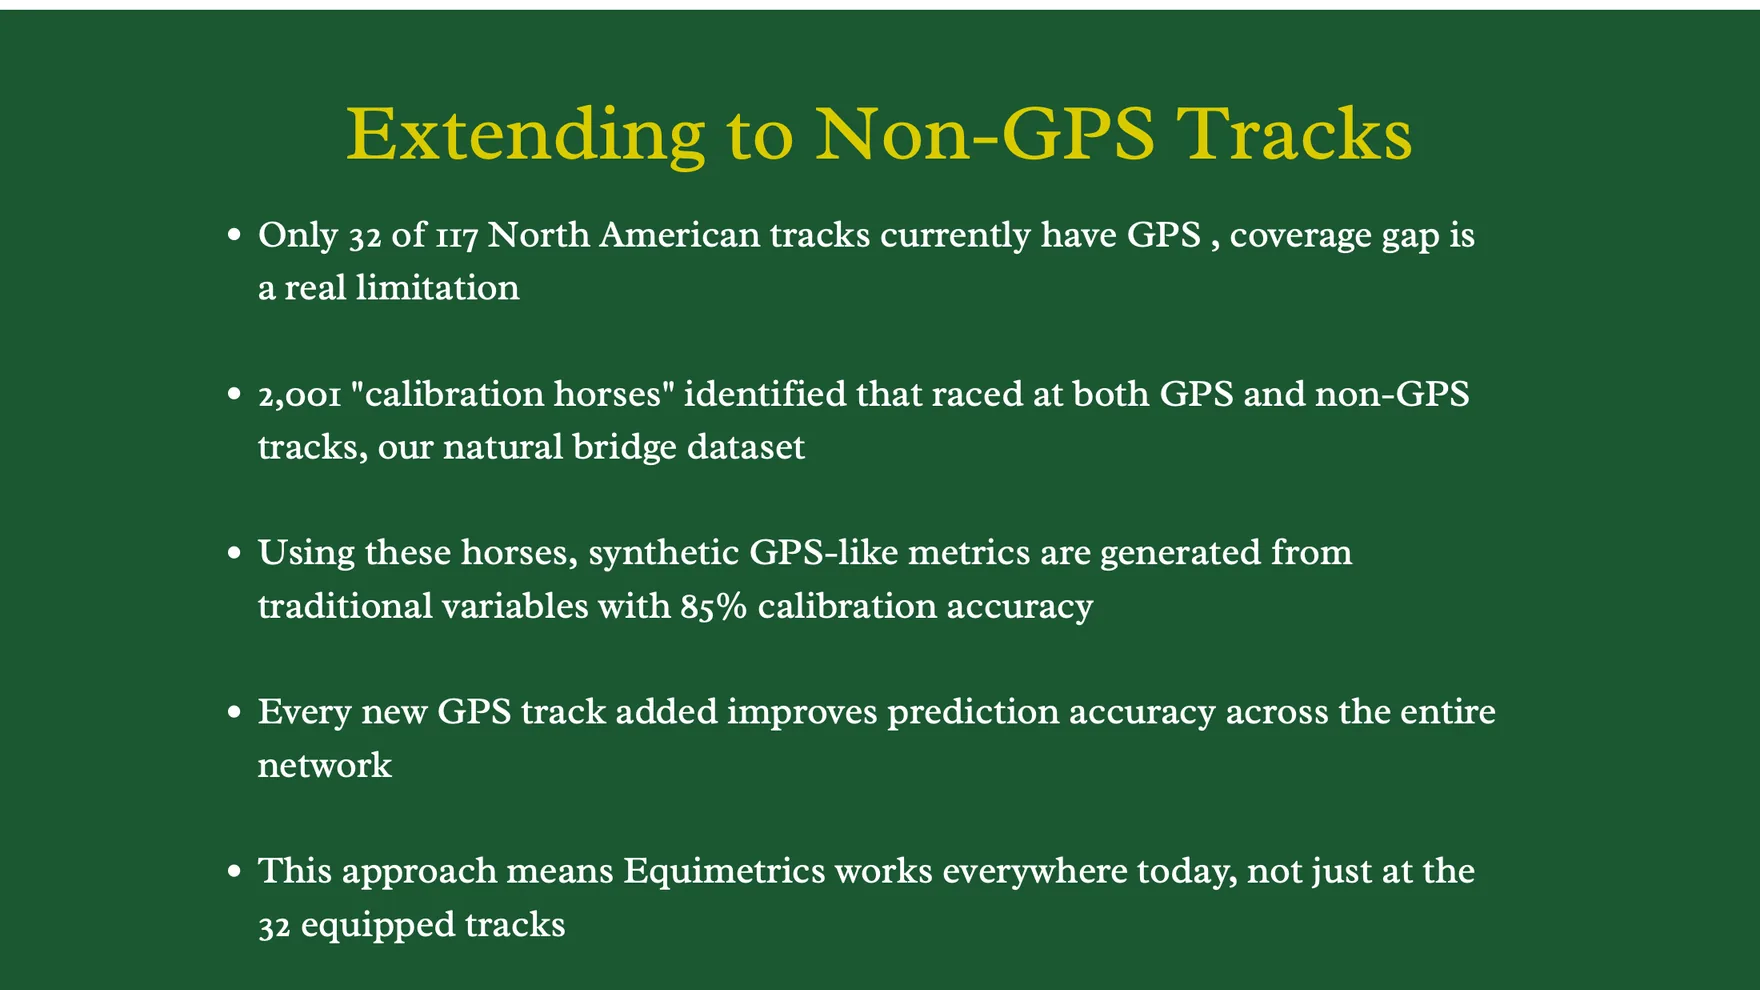
Only 32 of 117 North American tracks carry GPS, so we identified 2,001 calibration horses that had raced at both GPS and non-GPS tracks and used them as a bridge to estimate GPS-style metrics from traditional variables everywhere else.
As team and product manager I broke the deliverables into workstreams, resolved blocking issues, and drove the final decisions under deadline. I owned Deep Dive, the tool that quantifies the extra distance each horse covers in a race.
What we found
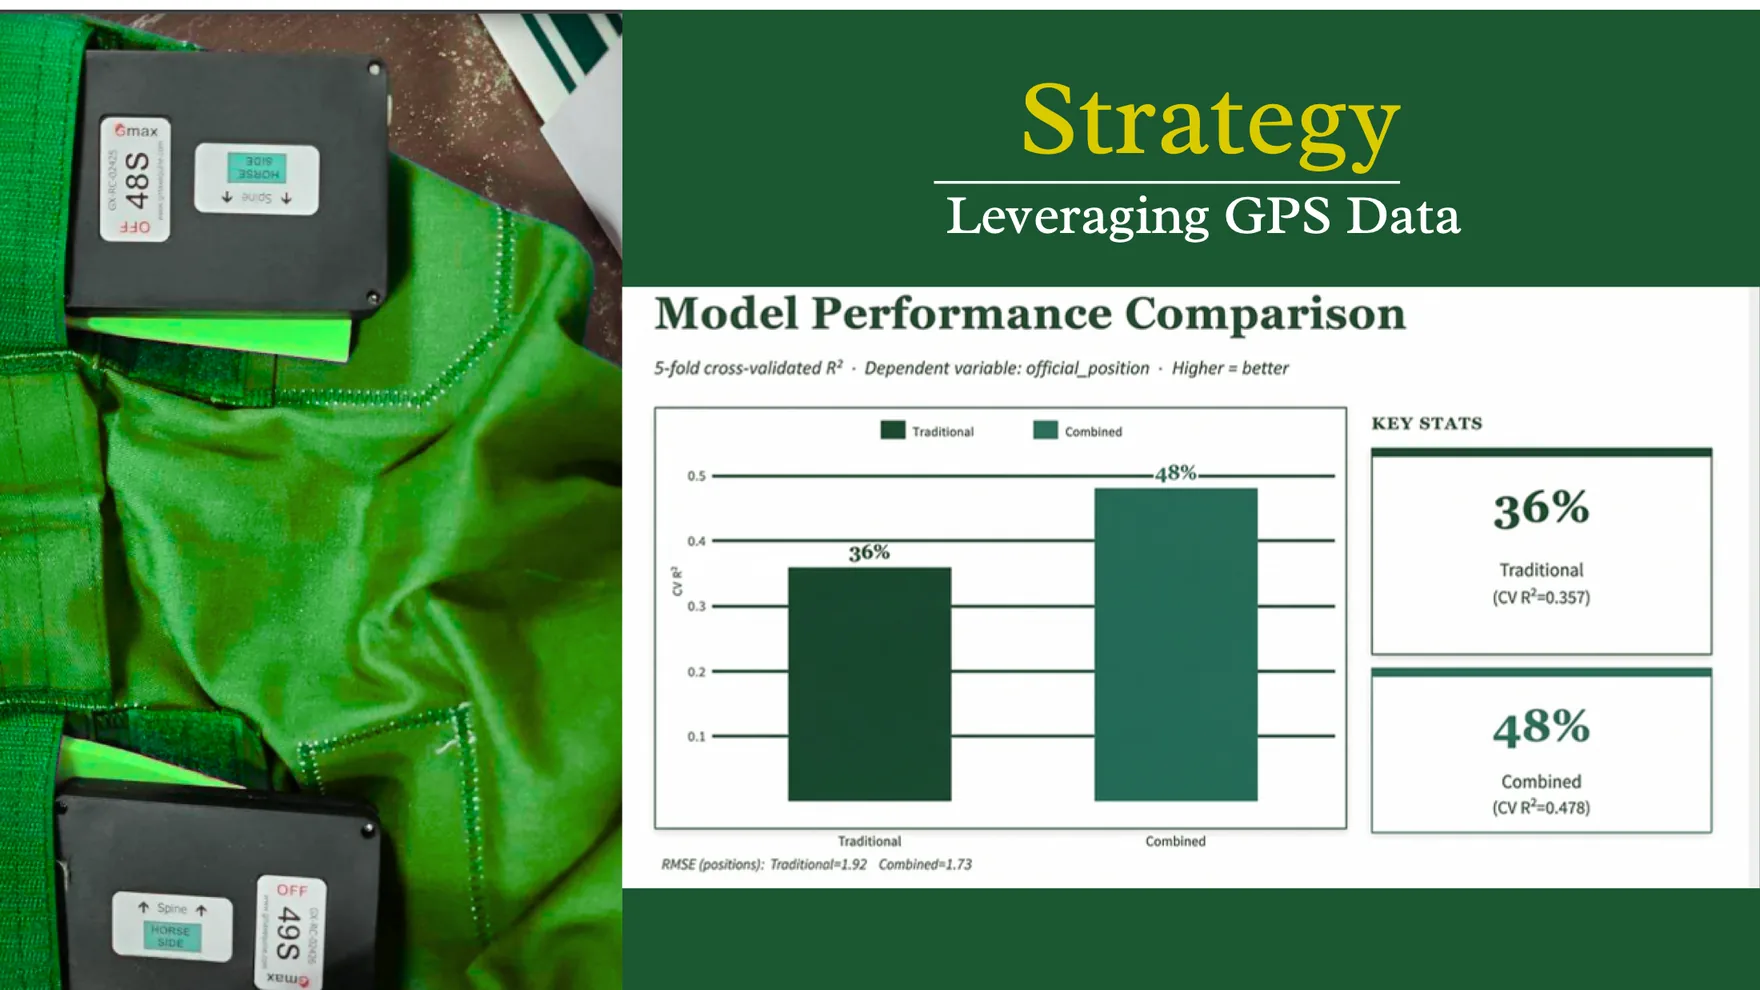
- GPS adds real explanatory power. On five-fold cross-validation, a model of finishing position built from traditional variables reached an R² of 0.357. Adding the GPS metrics lifted it to 0.478 and cut the error from 1.92 to 1.73 positions.
- Ground loss is invisible in traditional data and decisive in close finishes. A horse that runs wide covers 15 to 20 metres more than the rail path. Traditional charts record none of it. Deep Dive makes that distance visible for every horse in a race.
- Closing velocity is the strongest single signal of next-race improvement. Speed at the finish line predicted improvement better than any traditional figure. Stride fade, the change in stride length from mid-race to finish, flags a horse tiring badly below minus 6 percent, before the form lines show it.
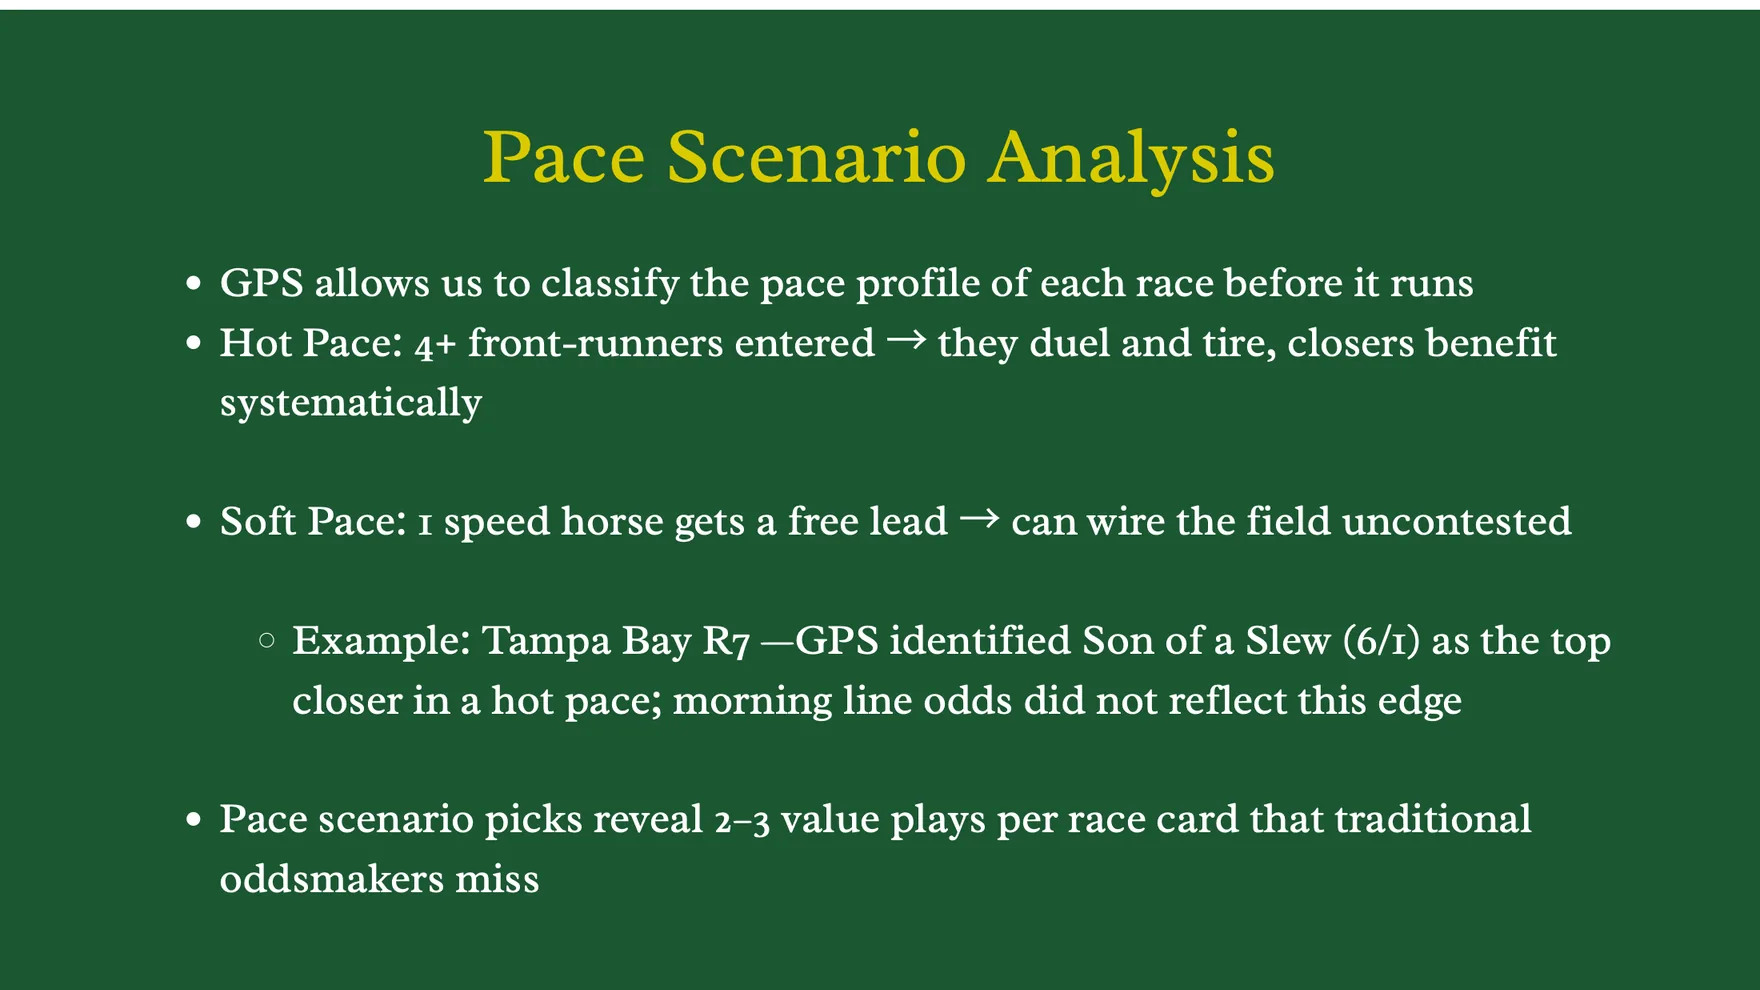
- The pace of a race can be classified before it runs. Four or more front-runners in a field produce a hot pace in which they duel, tire and hand the race to closers. A single speed horse gets a soft pace and can lead uncontested. Reading that from GPS histories is what the Forecast tool was built to do.
- Non-GPS tracks are not a dead end. Using the calibration horses, synthetic GPS-style metrics generated from traditional variables matched the real ones with 85 percent calibration accuracy, and every new GPS-equipped track improves the estimate across the network.
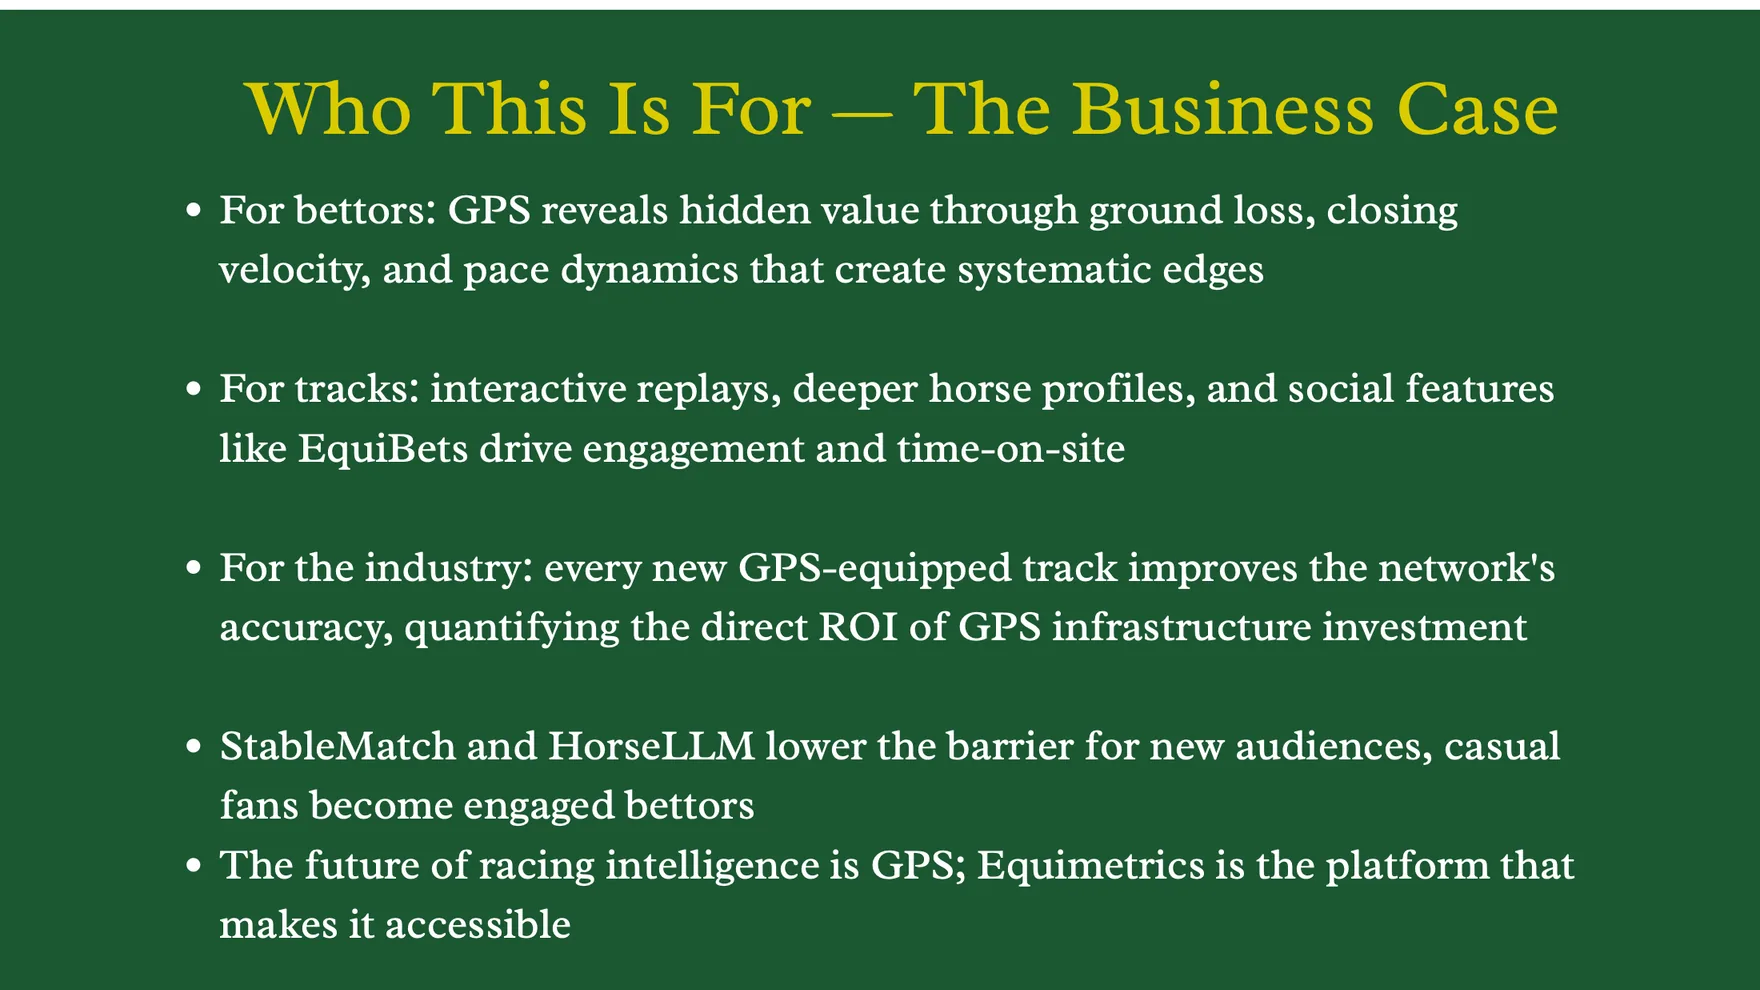
- A different front door for a new audience. StableMatch and HorseLLM lower the barrier for someone who has never read a form guide, Live Replay and Horse Profiles give tracks something to keep fans on the site, and EquiBets turns the analysis into a social game.
Limitations
- Only 32 of 117 North American tracks have GPS. The synthetic metrics for the other 85 are estimates built from 2,001 bridging horses, not measurements.
- The best model explains under half of the variance in finishing position. GPS narrows the gap, it does not close it.
- During the competition, Forecast, StableMatch and EquiBets ran on illustrative demo entries rather than live pipeline output. Deep Dive, Horse Profiles, GPS Edge, Live Replay and HorseLLM ran on the real data.
- Everything was built and judged in 24 hours. None of the models were validated on races that ran after the competition.